21_Data_Analysis_4_따릉이
import warnings
warnings.filterwarnings('ignore')
import requests
import folium
import json # json 타입의 문자열을 딕셔너리로 변환한다.
from pandas.io.json import json_normalize # 딕셔너리 타입의 데이터를 판다스 데이터프레임으로 변환한다.
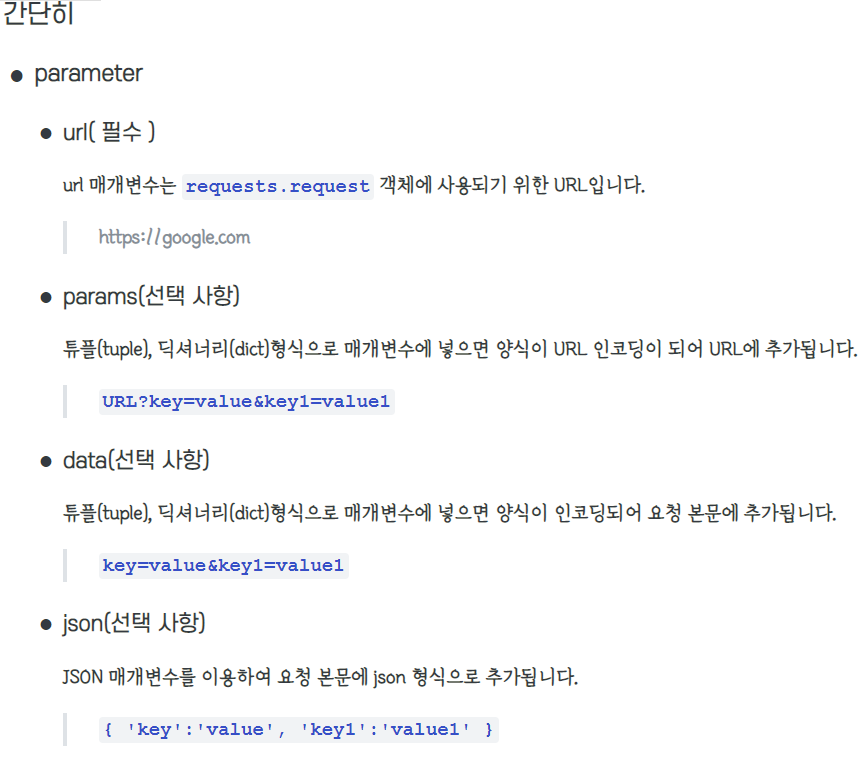
#아래 그림은 참고사항


[https://www.daleseo.com/python-requests/]: [https://me2nuk.com/Python-requests-module-example/#data%EC%84%A0%ED%83%9D-%EC%82%AC%ED%95%AD]:
targetSite = 'https://www.bikeseoul.com/app/station/getStationRealtimeStatus.do' # Request URL
# requests 모듈의 post 함수로 targetSite의 정보를 요청할 때 Form Data의 정보를 서버에 전송해야 한다.
request = requests.post(targetSite, data={
    'stationGrpSeq': 'ALL'
})
print(request)
print(type(request.text))
print(request.text)

서버에서 응답받은 문자열인 json 타입의 데이터를 파이썬에서 처리하기 위해 딕셔너리로 변환한다.
# json 모듈의 loads() 함수로 크롤링한 json 형태의 문자열 데이터를 파이썬에서 처리하기에 적합하도록 딕셔너리 타입으로 변환한다.
bike_json = json.loads(request.text)
print(type(bike_json))
print(bike_json)

# requests 모듈의 json() 함수로 크롤링한 json 형태의 문자열 데이터를 파이썬에서 처리하기에 적합하도록 딕셔너리 타입으로
# 변환한다.
bike_json = request.json()
print(type(bike_json))
print(bike_json)

판다스의 json_normalize() 함수를 사용해서 딕셔너리 타입의 데이터를 판다스 데이터프레임으로 변환한다.
# json_normalize(딕셔너리이름, '딕셔너리에서 데이터프레임으로 변경할 데이터와 연결된 키 이름')
print(bike_json.keys())
bike_df = json_normalize(bike_json, 'realtimeList')
bike_df

bike_df.columns

필요한 컬럼 몇 가지를 선택해서 지도에 마커를 표시할 때 사용할 데이터가 저장된 데이터프레임을 만든다.
# stationName => 대여소 이름
# stationLongitude => 대여소 경도
# stationLatitude => 대여소 위도
# rackTotCnt => 주차 가능한 전체 자전거 대수
# parkingBikeTotCnt => 주차된 자전거 LCD형 대수 => 따릉이(LCD형)
# parkingQRBikeCnt => 주차된 자전거 QR형 대수 => 뉴따릉이(QR형)
# parkingELECBikeCnt => 주차된 자전거 대수 => 새싹 따릉이

bike_df_map = bike_df[['stationName', 'stationLongitude', 'stationLatitude', 'rackTotCnt', 'parkingBikeTotCnt',
                       'parkingQRBikeCnt', 'parkingELECBikeCnt']]
bike_df_map

bike_df_map.dtypes

bike_df_map['stationLongitude'] = bike_df_map['stationLongitude'].astype(float)
bike_df_map['stationLatitude'] = bike_df_map['stationLatitude'].astype(float)
bike_df_map['rackTotCnt'] = bike_df_map['rackTotCnt'].astype(int)
bike_df_map['parkingBikeTotCnt'] = bike_df_map['parkingBikeTotCnt'].astype(int)
bike_df_map['parkingQRBikeCnt'] = bike_df_map['parkingQRBikeCnt'].astype(int)
bike_df_map['parkingELECBikeCnt'] = bike_df_map['parkingELECBikeCnt'].astype(int)
bike_df_map['total'] = bike_df_map['parkingBikeTotCnt'] + bike_df_map['parkingQRBikeCnt'] + bike_df_map['parkingELECBikeCnt']
bike_df_map.dtypes

bike_df_map.head()

bike_df_map.tail()

# 위치 정보가 잘못된 데이터
bike_df_map[(bike_df_map['stationLongitude'] <= 125) | (bike_df_map['stationLatitude'] <= 37)]
bike_df_map = bike_df_map[(bike_df_map['stationLongitude'] > 125) & (bike_df_map['stationLatitude'] > 37)]
bike_df_map

시각화
bike_map = folium.Map(location=[bike_df_map['stationLatitude'].mean(), bike_df_map['stationLongitude'].mean()], zoom_start=12)

# iterrows(): 데이터프레임에 저장된 데이터를 한 건씩 반복하며 인덱스와 데이터를 리턴시킨다.
for index, data in bike_df_map.iterrows():
    stationName = '{}: 따릉이(LCD) {}대, 뉴따릉이(QR) {}대, 새싹 따릉이 {}대'.format(data['stationName'],
                                data['parkingBikeTotCnt'], data['parkingQRBikeCnt'], data['parkingELECBikeCnt'])
    popupMessage = folium.Popup(stationName, max_width=250)
    folium.Marker(location=[data['stationLatitude'], data['stationLongitude']], popup=popupMessage,
                 icon=folium.Icon(color='green', icon='arrow-down')).add_to(bike_map)

bike_map.save('./output/bike.html')
bike_map

bike_map = folium.Map(location=[bike_df_map['stationLatitude'].mean(), bike_df_map['stationLongitude'].mean()], zoom_start=12)
for index, data in bike_df_map.iterrows():
    stationName = '{}: 따릉이(LCD) {}대, 뉴따릉이(QR) {}대, 새싹 따릉이 {}대'.format(data['stationName'],
                                data['parkingBikeTotCnt'], data['parkingQRBikeCnt'], data['parkingELECBikeCnt'])
    popupMessage = folium.Popup(stationName, max_width=250)
    folium.CircleMarker(location=[data['stationLatitude'], data['stationLongitude']], popup=popupMessage,
                 radius=1, color='#FF0000').add_to(bike_map)
bike_map.save('./output/bike.html')
bike_map

댓글남기기