37_Decision_Tree_의사결정트리
import warnings
warnings.filterwarnings('ignore')
import numpy as np
import pandas as pd
import matplotlib.pyplot as plt
import seaborn as sns
import sklearn

#군대의 지니계수가 더 커서, 판단하는데 더 유용하다.
from IPython.display import Image
Image('./data/Decision_tree.png', width ='1000')

데이터 획득
district=>구,
dong=>동,
latitude=>위도,
longitude=>경도
label=>강동,강서,강남,강북으로 구분한 지역
#구 데이터 => 학습데이터
district_dict_list = [
    {'district': 'Gangseo-gu', 'latitude': 37.551000, 'longitude': 126.849500, 'label':'Gangseo'},
    {'district': 'Yangcheon-gu', 'latitude': 37.52424, 'longitude': 126.855396, 'label':'Gangseo'},
    {'district': 'Guro-gu', 'latitude': 37.4954, 'longitude': 126.8874, 'label':'Gangseo'},
    {'district': 'Geumcheon-gu', 'latitude': 37.4519, 'longitude': 126.9020, 'label':'Gangseo'},
    {'district': 'Mapo-gu', 'latitude': 37.560229, 'longitude': 126.908728, 'label':'Gangseo'},

    {'district': 'Gwanak-gu', 'latitude': 37.487517, 'longitude': 126.915065, 'label':'Gangnam'},
    {'district': 'Dongjak-gu', 'latitude': 37.5124, 'longitude': 126.9393, 'label':'Gangnam'},
    {'district': 'Seocho-gu', 'latitude': 37.4837, 'longitude': 127.0324, 'label':'Gangnam'},
    {'district': 'Gangnam-gu', 'latitude': 37.5172, 'longitude': 127.0473, 'label':'Gangnam'},
    {'district': 'Songpa-gu', 'latitude': 37.503510, 'longitude': 127.117898, 'label':'Gangnam'},

    {'district': 'Yongsan-gu', 'latitude': 37.532561, 'longitude': 127.008605, 'label':'Gangbuk'},
    {'district': 'Jongro-gu', 'latitude': 37.5730, 'longitude': 126.9794, 'label':'Gangbuk'},
    {'district': 'Seongbuk-gu', 'latitude': 37.603979, 'longitude': 127.056344, 'label':'Gangbuk'},
    {'district': 'Nowon-gu', 'latitude': 37.6542, 'longitude': 127.0568, 'label':'Gangbuk'},
    {'district': 'Dobong-gu', 'latitude': 37.6688, 'longitude': 127.0471, 'label':'Gangbuk'},

    {'district': 'Seongdong-gu', 'latitude': 37.557340, 'longitude': 127.041667, 'label':'Gangdong'},
    {'district': 'Dongdaemun-gu', 'latitude': 37.575759, 'longitude': 127.025288, 'label':'Gangdong'},
    {'district': 'Gwangjin-gu', 'latitude': 37.557562, 'longitude': 127.083467, 'label':'Gangdong'},
    {'district': 'Gangdong-gu', 'latitude': 37.554194, 'longitude': 127.151405, 'label':'Gangdong'},
    {'district': 'Jungrang-gu', 'latitude': 37.593684, 'longitude': 127.090384, 'label':'Gangdong'}
 ]

#동 데이터 => 테스트 데이터
dong_dict_list = [
    {'dong': 'Gaebong-dong', 'latitude': 37.489853, 'longitude': 126.854547, 'label':'Gangseo'},
    {'dong': 'Gochuk-dong', 'latitude': 37.501394, 'longitude': 126.859245, 'label':'Gangseo'},
    {'dong': 'Hwagok-dong', 'latitude': 37.537759, 'longitude': 126.847951, 'label':'Gangseo'},
    {'dong': 'Banghwa-dong', 'latitude': 37.575817, 'longitude': 126.815719, 'label':'Gangseo'},
    {'dong': 'Sangam-dong', 'latitude': 37.577039, 'longitude': 126.891620, 'label':'Gangseo'},

    {'dong': 'Nonhyun-dong', 'latitude': 37.508838, 'longitude': 127.030720, 'label':'Gangnam'},
    {'dong': 'Daechi-dong', 'latitude': 37.501163, 'longitude': 127.057193, 'label':'Gangnam'},
    {'dong': 'Seocho-dong', 'latitude': 37.486401, 'longitude': 127.018281, 'label':'Gangnam'},
    {'dong': 'Bangbae-dong', 'latitude': 37.483279, 'longitude': 126.988194, 'label':'Gangnam'},
    {'dong': 'Dogok-dong', 'latitude': 37.492896, 'longitude': 127.043159, 'label':'Gangnam'},

    {'dong': 'Pyoungchang-dong', 'latitude': 37.612129, 'longitude': 126.975724, 'label':'Gangbuk'},
    {'dong': 'Sungbuk-dong', 'latitude': 37.597916, 'longitude': 126.998067, 'label':'Gangbuk'},
    {'dong': 'Ssangmoon-dong', 'latitude': 37.648094, 'longitude': 127.030421, 'label':'Gangbuk'},
    {'dong': 'Ui-dong', 'latitude': 37.648446, 'longitude': 127.011396, 'label':'Gangbuk'},
    {'dong': 'Samcheong-dong', 'latitude': 37.591109, 'longitude': 126.980488, 'label':'Gangbuk'},

    {'dong': 'Hwayang-dong', 'latitude': 37.544234, 'longitude': 127.071648, 'label':'Gangdong'},
    {'dong': 'Gui-dong', 'latitude': 37.543757, 'longitude': 127.086803, 'label':'Gangdong'},
    {'dong': 'Neung-dong', 'latitude': 37.553102, 'longitude': 127.080248, 'label':'Gangdong'},
    {'dong': 'Amsa-dong', 'latitude': 37.552370, 'longitude': 127.127124, 'label':'Gangdong'},
    {'dong': 'Chunho-dong', 'latitude': 37.547436, 'longitude': 127.137382, 'label':'Gangdong'}
 ]
train_df=pd.DataFrame(district_dict_list)
train_df.head()
| district | latitude | longitude | label | |
|---|---|---|---|---|
| 0 | Gangseo-gu | 37.551000 | 126.849500 | Gangseo |
| 1 | Yangcheon-gu | 37.524240 | 126.855396 | Gangseo |
| 2 | Guro-gu | 37.495400 | 126.887400 | Gangseo |
| 3 | Geumcheon-gu | 37.451900 | 126.902000 | Gangseo |
| 4 | Mapo-gu | 37.560229 | 126.908728 | Gangseo |
test_df=pd.DataFrame(dong_dict_list)
test_df.head()
| dong | latitude | longitude | label | |
|---|---|---|---|---|
| 0 | Gaebong-dong | 37.489853 | 126.854547 | Gangseo |
| 1 | Gochuk-dong | 37.501394 | 126.859245 | Gangseo |
| 2 | Hwagok-dong | 37.537759 | 126.847951 | Gangseo |
| 3 | Banghwa-dong | 37.575817 | 126.815719 | Gangseo |
| 4 | Sangam-dong | 37.577039 | 126.891620 | Gangseo |
sns.lmplot(data=train_df, x='longitude', y='latitude',
           fit_reg=False, hue='label', markers=['o','x','s','^'],
           scatter_kws={'s':80})
plt.title('district visualization in 2D Plane')

sns.lmplot(data=test_df, x='longitude', y='latitude',
           fit_reg=False, hue='label', markers=['o','x','s','^'],
           scatter_kws={'s':80})
plt.title('dong visualization in 2D Plane')
plt.show()


데이터 전처리
#위 시각화 결과를 통해 구,동 이름이 학습이나 테스트에
#별 영향을 미치지 않는다는 점을 알았으므로 학습 및 테스트에
#필요없는 특징을 데이터에서 제거한다.

#학습 데이터에서 구 제거
train_df.drop(['district'], axis=1, inplace=True)

#테스트 데이터에서 구 제거
test_df.drop(['dong'], axis=1, inplace=True)
x_train = train_df[['longitude', 'latitude']]
y_train = train_df[['label']]
x_test = test_df[['longitude', 'latitude']]
y_test = test_df[['label']]
모델 학습
사이킷런의 의사결정 트리를 로드해서 학습힌다.
from sklearn import tree
from sklearn import preprocessing
#사이킷런의 preprocessing에 포함된 LabelEncoder 객체는
#데이터를 모델화하고 학습시키기 위해서 fit_transform를
#이용해 숫자로 만든다.Spain, Germany, France가 있는 경우,
#Spain는0,Germany는 1, France를 2라고 정의하려는 경우 사용한다.
le=preprocessing.LabelEncoder()
y_encoded=le.fit_transform(y_train)
print(y_encoded)
[3 3 3 3 3 2 2 2 2 2 0 0 0 0 0 1 1 1 1 1]
#DecisionTreeClassifier() 함수로 의사결정 트리를 학습시킨다.
#의사결정 트리의 내부 알고리즘 구동시 랜덤하게 특성들과
#데이터의 건수를 선택하는 로직이 포함되어 있다. random_state로
#특정값을 지정하여 의사결정 트리 수행시 마다 동일한 Rule의
#트리를 만들 수 있다.
clf = tree.DecisionTreeClassifier(random_state=35).fit(x_train,y_encoded)
의사결정 트리를 시각화 하는 함수를 만든다.
print(np.array([1,2,3]))
print(np.array([4,5,6]))

#np.c_[a,b] =>두 개의 1차원 배열을 붙여서 2차원 배열을 만든다.
print(np.c_[np.array([1,2,3]),np.array([4,5,6])])
[1 2 3]
[4 5 6]
[[1 4]
 [2 5]
 [3 6]]
def display_decision_surface(clf, x, y):
    x_min = x.longitude.min() - 0.01;
    x_max = x.longitude.max() + 0.01;
    y_min = x.latitude.min() - 0.01;
    y_max = x.latitude.max() + 0.01;

    # classes_: LabelEncoder 객체의 fit_transform() 함수를 실행했을 때 숫자로 대체된 문자열의 개수를 의미한다.
    n_classes = len(le.classes_)
    # print(n_classes)
    plot_color = 'rywb'
    plot_step = 0.001

    # meshgrid() 함수는 좌표 벡터로 부터 좌표 행렬을 반환한다.
    xx, yy = np.meshgrid(np.arange(x_min, x_max, plot_step), np.arange(y_min, y_max, plot_step))

    # predict() 함수는 학습 결과에 따른 예측을 한다.
    Z = clf.predict(np.c_[xx.ravel(), yy.ravel()])
    Z = Z.reshape(xx.shape)
    # print(Z)
    plt.contourf(xx, yy, Z, cmap=plt.cm.RdYlBu) # 등고선 차트

    for i, color in zip(range(n_classes), plot_color):
        # print(i, color)
        # np.where(): 조건에 만족하는 값의 인덱스를 찾는다.
        idx = np.where(y == i)
        # print(idx)
        plt.scatter(x=x.loc[idx].longitude, y=x.loc[idx].latitude, c=color, label=le.classes_[i], cmap=plt.cm.RdYlBu,
                   edgecolor='black', s=100)
    # =======================

    plt.title('Decision surface of a decision tree', fontsize=20)
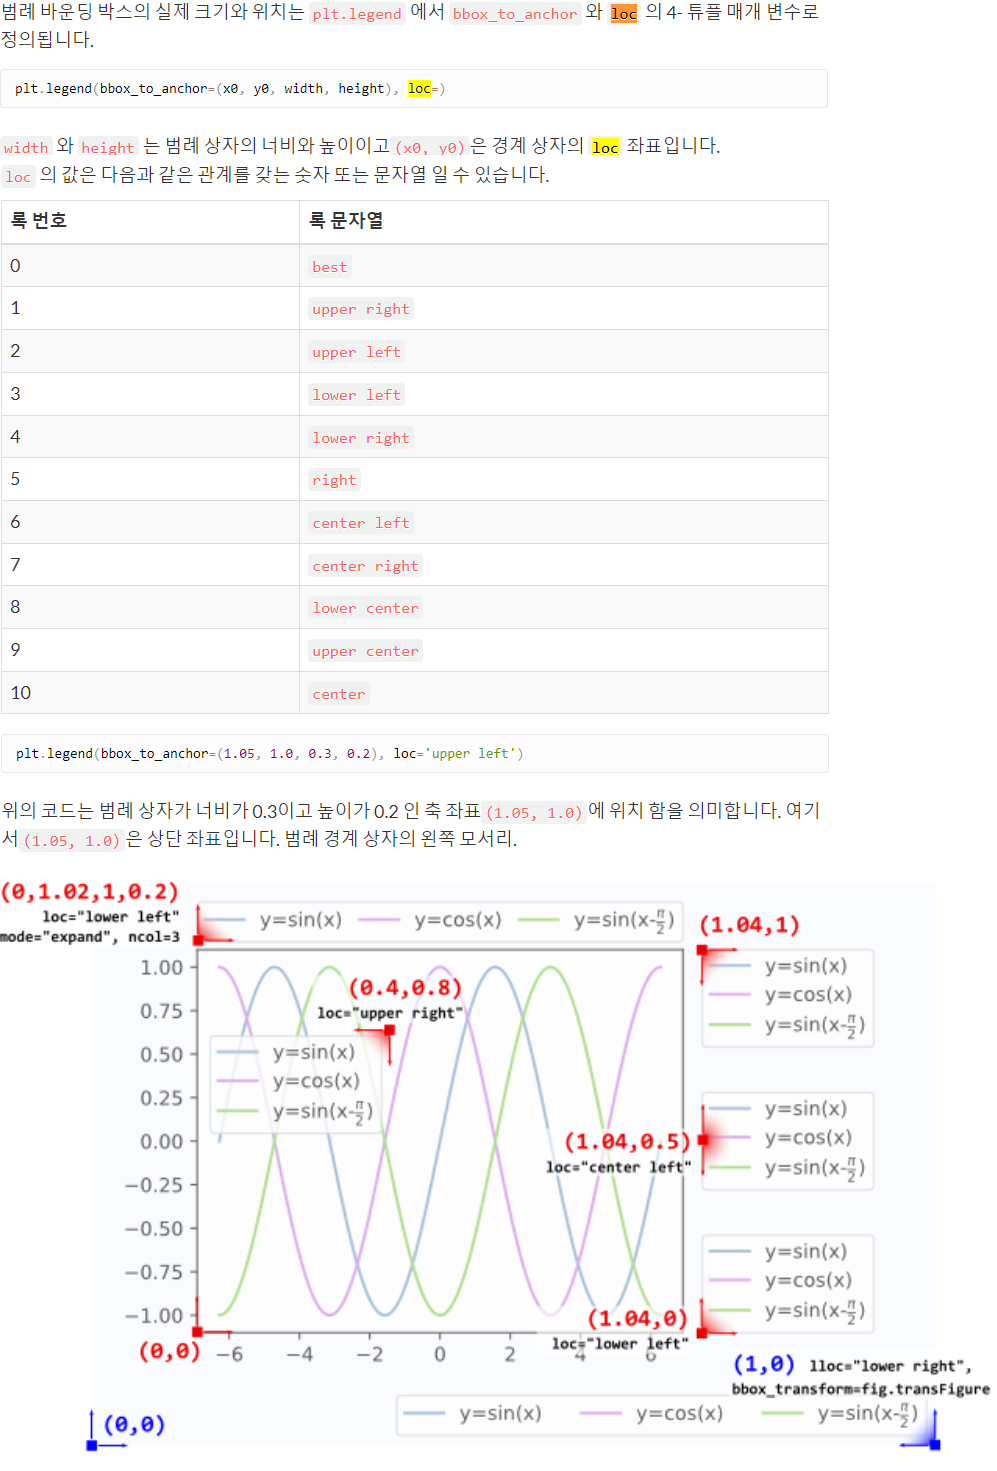
    plt.legend(bbox_to_anchor=[1.05, 1], loc=2, borderaxespad=0, fontsize=14) # 범례
    plt.xlabel('longitude', fontsize=14)
    plt.ylabel('latitude', fontsize=14)

    plt.rcParams['figure.figsize'] = [10, 7]
    # plt.rcParams['font.size'] = 30 # x, y축 레이블의 크기를 동시에 변경한다.
    plt.rcParams['xtick.labelsize'] = 15 # x축 레이블 크기를 변경한다.
    plt.rcParams['ytick.labelsize'] = 15 # y축 레이블 크기를 변경한다.
    plt.show()


display_decision_surface(clf, x_train, y_encoded)

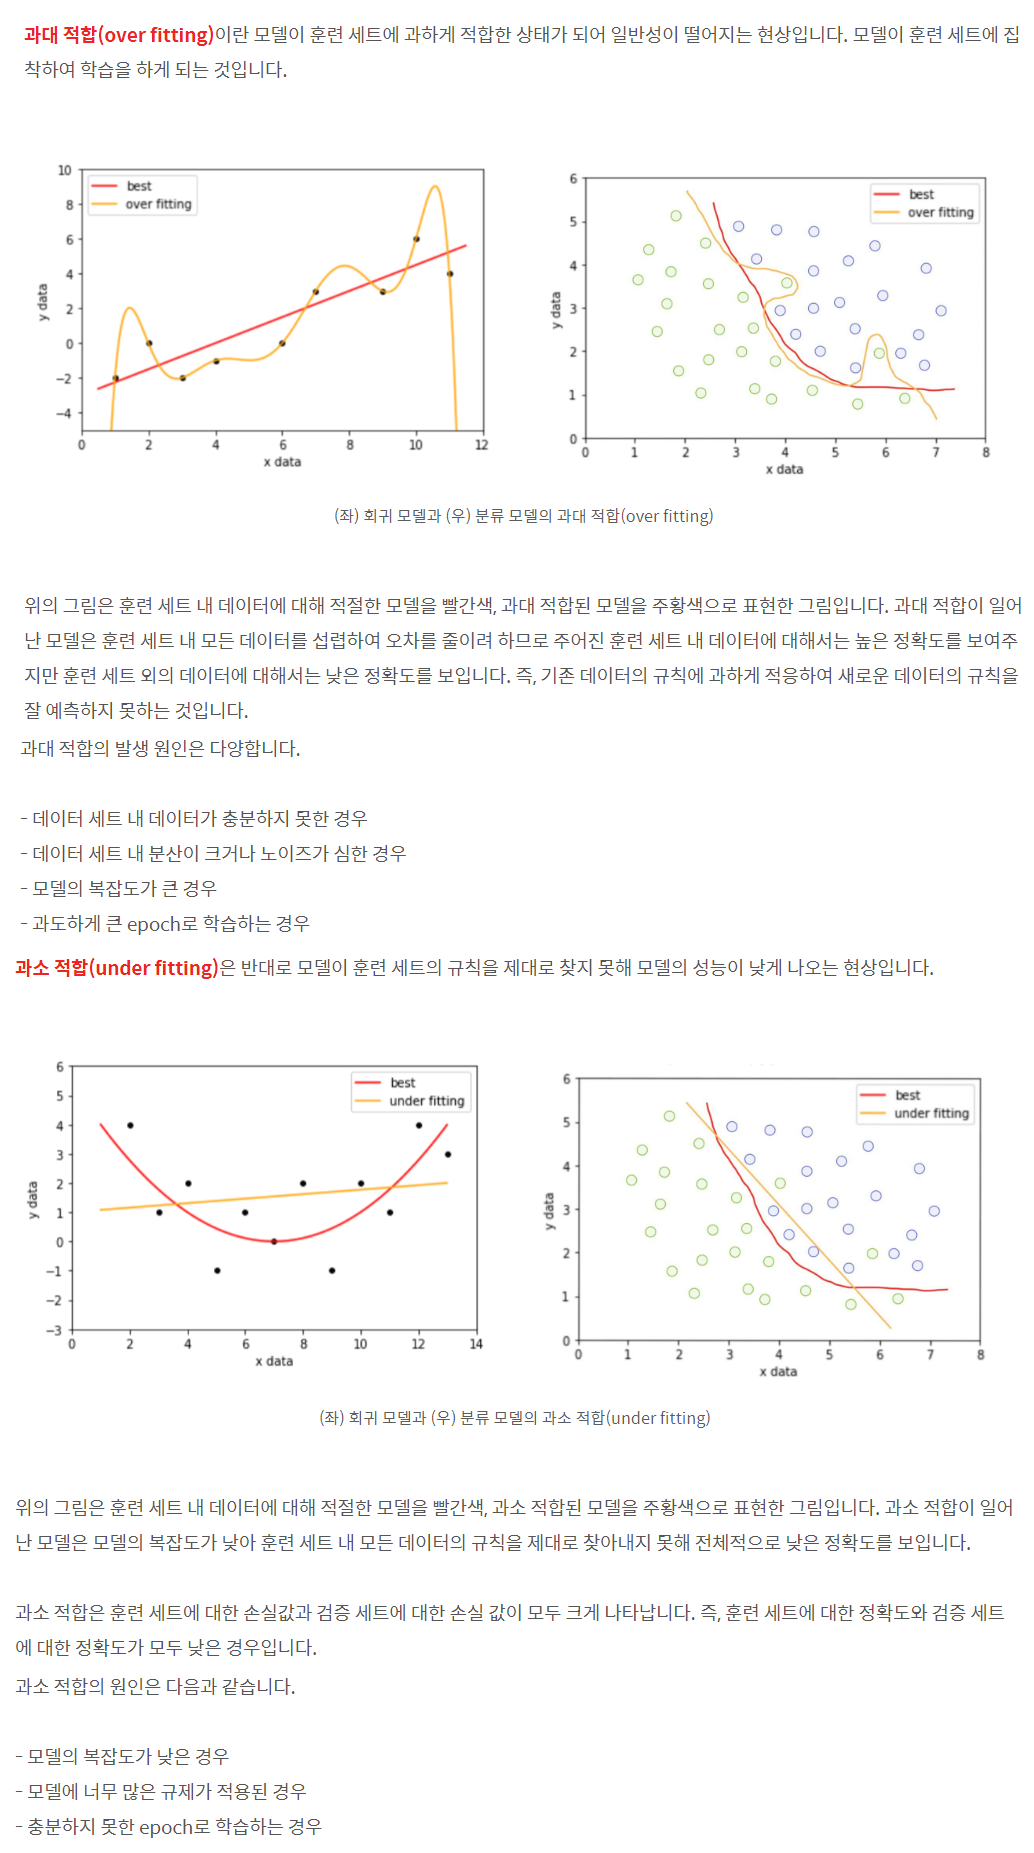
의사결정 트리는 과대 적합되기가 상당히 쉬운 모델이다.
사이킷런의 의사결정 트리는 과대 적합을 피할 수 있도록
별도의 파라미터를 제공하는데 파라미터를 설정하지 않을
경우 모델은 학습되지만 과대 적합될 가능성이 높다.
여기서 아무런 파라미터 설정 없이 학습 데이터를 학습한
의사결정 트리의 결정 표면을 시각화 해 보았다.

위의 차트는 강북 사이에 강동에 해당되는 데이터가 보이는것으로
봐서 학습 데이터에만 너무 치우치게 학습되었다. 즉, 과대
적합되었다고 판단할 수 있다.
#과대 적합을 피하기 위해 파라미터를 설정한다.
#max_depth : 트리의 최대 깊이
#min_samples_split : 자식 노드를 가지기 위한 최소한의 데이터 개수
#min_samples_leaf : 리프(터미널, 단노드, 자식이 없는 노드)노드의 최소 데이터 개수
clf = tree.DecisionTreeClassifier(max_depth=4, min_samples_split=2, random_state=35, min_samples_leaf=2).fit(x_train,y_encoded)
display_decision_surface(clf, x_train, y_encoded)

모델 테스트
from sklearn.metrics import accuracy_score
#모델 정확도를 예측한다.
pred = clf.predict(x_test)

#정확도를 출력한다.
print('정확도 : {}'.format(accuracy_score(y_test.values.ravel(),
                                      le.classes_[pred])))
정확도 : 1.0
comparison = pd.DataFrame({'실제값': y_test.values.ravel(), '예측값': le.classes_[pred]})
comparison
| 실제값 | 예측값 | |
|---|---|---|
| 0 | Gangseo | Gangseo |
| 1 | Gangseo | Gangseo |
| 2 | Gangseo | Gangseo |
| 3 | Gangseo | Gangseo |
| 4 | Gangseo | Gangseo |
| 5 | Gangnam | Gangnam |
| 6 | Gangnam | Gangnam |
| 7 | Gangnam | Gangnam |
| 8 | Gangnam | Gangnam |
| 9 | Gangnam | Gangnam |
| 10 | Gangbuk | Gangbuk |
| 11 | Gangbuk | Gangbuk |
| 12 | Gangbuk | Gangbuk |
| 13 | Gangbuk | Gangbuk |
| 14 | Gangbuk | Gangbuk |
| 15 | Gangdong | Gangdong |
| 16 | Gangdong | Gangdong |
| 17 | Gangdong | Gangdong |
| 18 | Gangdong | Gangdong |
| 19 | Gangdong | Gangdong |
# 정확도 예측 후 임의의 내용을 테스트 데이터를 만든다.
dong_dict_list = [
    {'latitude': 37.489853, 'longitude': 126.854547, 'label':'Gangseo'},
    {'latitude': 37.501394, 'longitude': 126.859245, 'label':'Gangnam'},
    {'latitude': 37.537759, 'longitude': 126.847951, 'label':'Gangseo'},
    {'latitude': 37.575817, 'longitude': 126.815719, 'label':'Gangdong'},
    {'latitude': 37.577039, 'longitude': 126.891620, 'label':'Gangseo'}
]

test_df = pd.DataFrame(dong_dict_list)
x_test = test_df[['longitude', 'latitude']]
y_test = test_df[['label']]
# 임의의 데이터에 대해 학습시킨다.
pred = clf.predict(x_test)
print('정확도: {}'.format(accuracy_score(y_test.values.ravel(), le.classes_[pred])))
comparison = pd.DataFrame({'실제값': y_test.values.ravel(), '예측값': le.classes_[pred]})
comparison
정확도: 0.6
| 실제값 | 예측값 | |
|---|---|---|
| 0 | Gangseo | Gangseo |
| 1 | Gangnam | Gangseo |
| 2 | Gangseo | Gangseo |
| 3 | Gangdong | Gangseo |
| 4 | Gangseo | Gangseo |
의사결정 트리 시각화 및 pdf 파일로 만들기
#graphviz를 설치하려면 아래와 같은 과정을 먼저
#실행해야 한다.
#graphviz 웹 사이트에서 설치 파일을 다운로드 받아 설치한다.
#!pip install graphviz
#환경 변수(위쪽)Path에 C:\Program Files\Graphviz\bin가 없으면 추가한다.
import graphviz
dot_data = tree.export_graphviz(clf, out_file=None,
                               feature_names=['longitude','latitude'],
                               class_names=['Gangbuk', 'Gangdong','Gangnam', 'Gangseo'],
                               filled=True, rounded=True, special_characters=True)
graph = graphviz.Source(dot_data)

#랜더링된 의사결정 트리를 pdf파일로 생성한다.
graph.render('seoul')
graph

댓글남기기