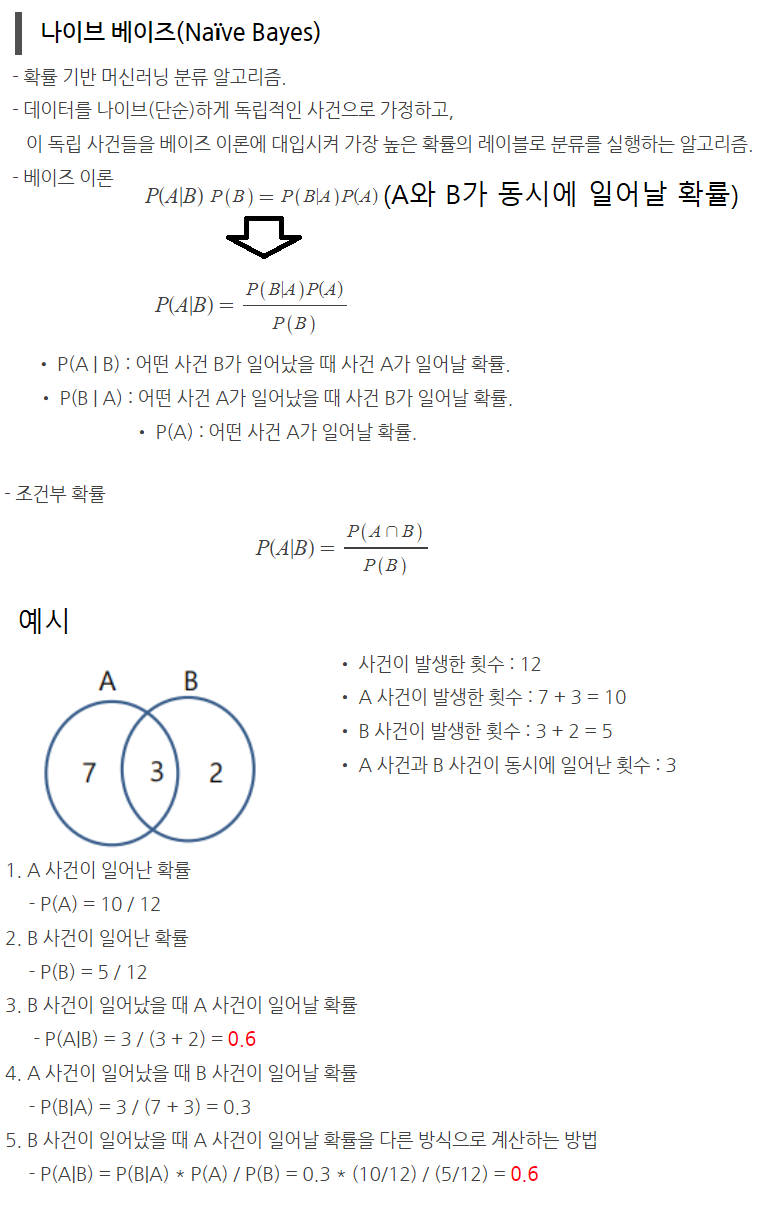
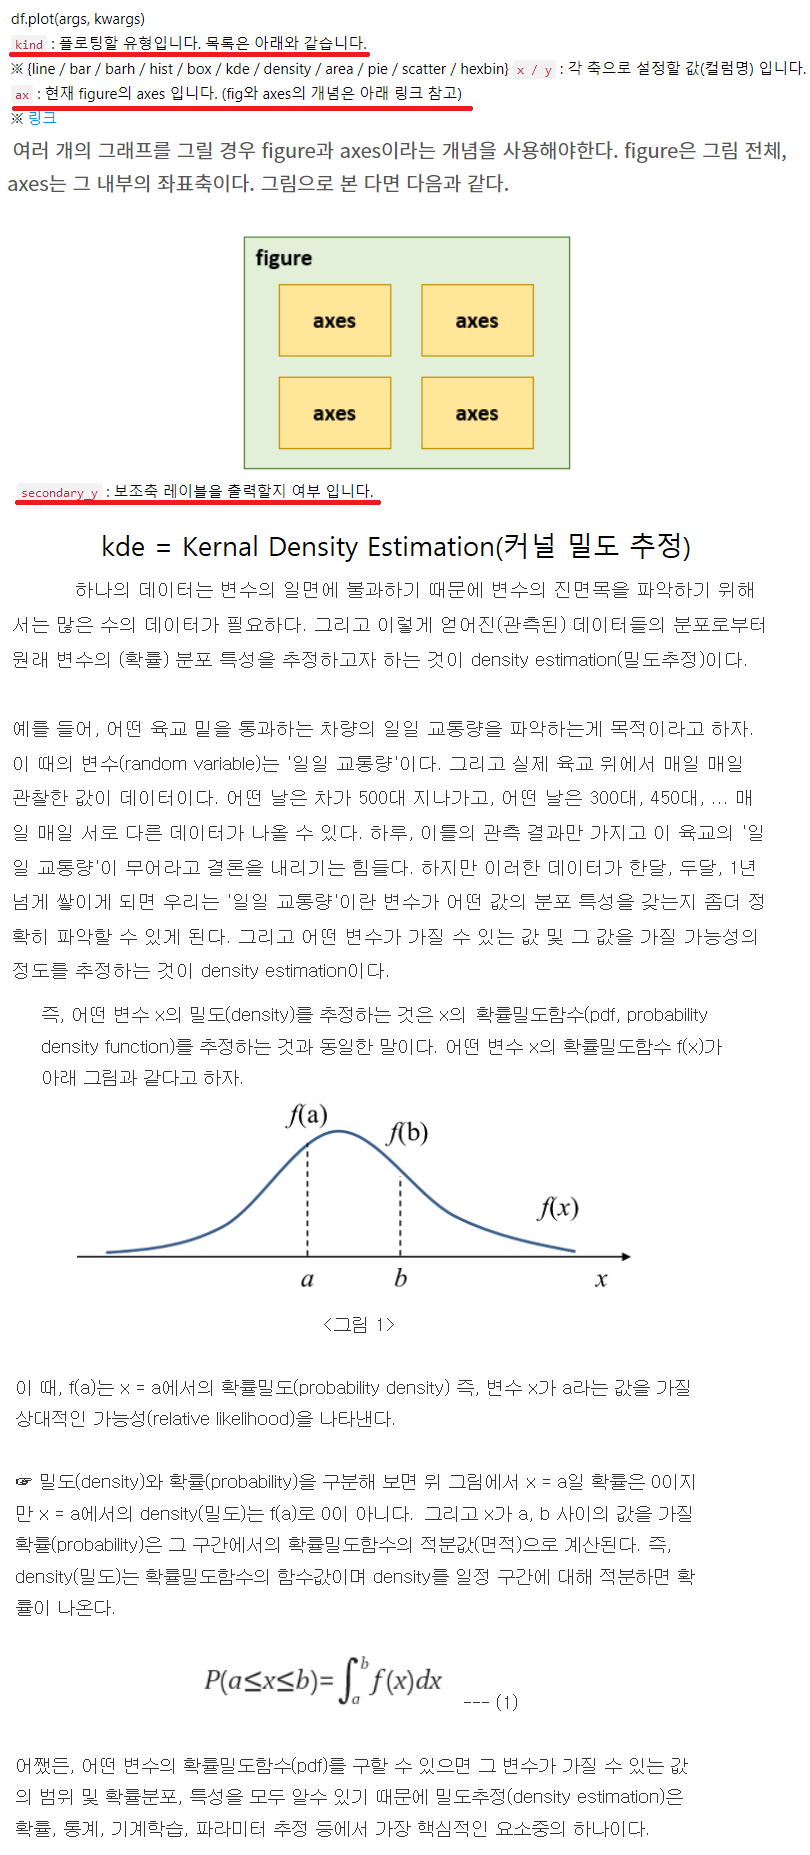
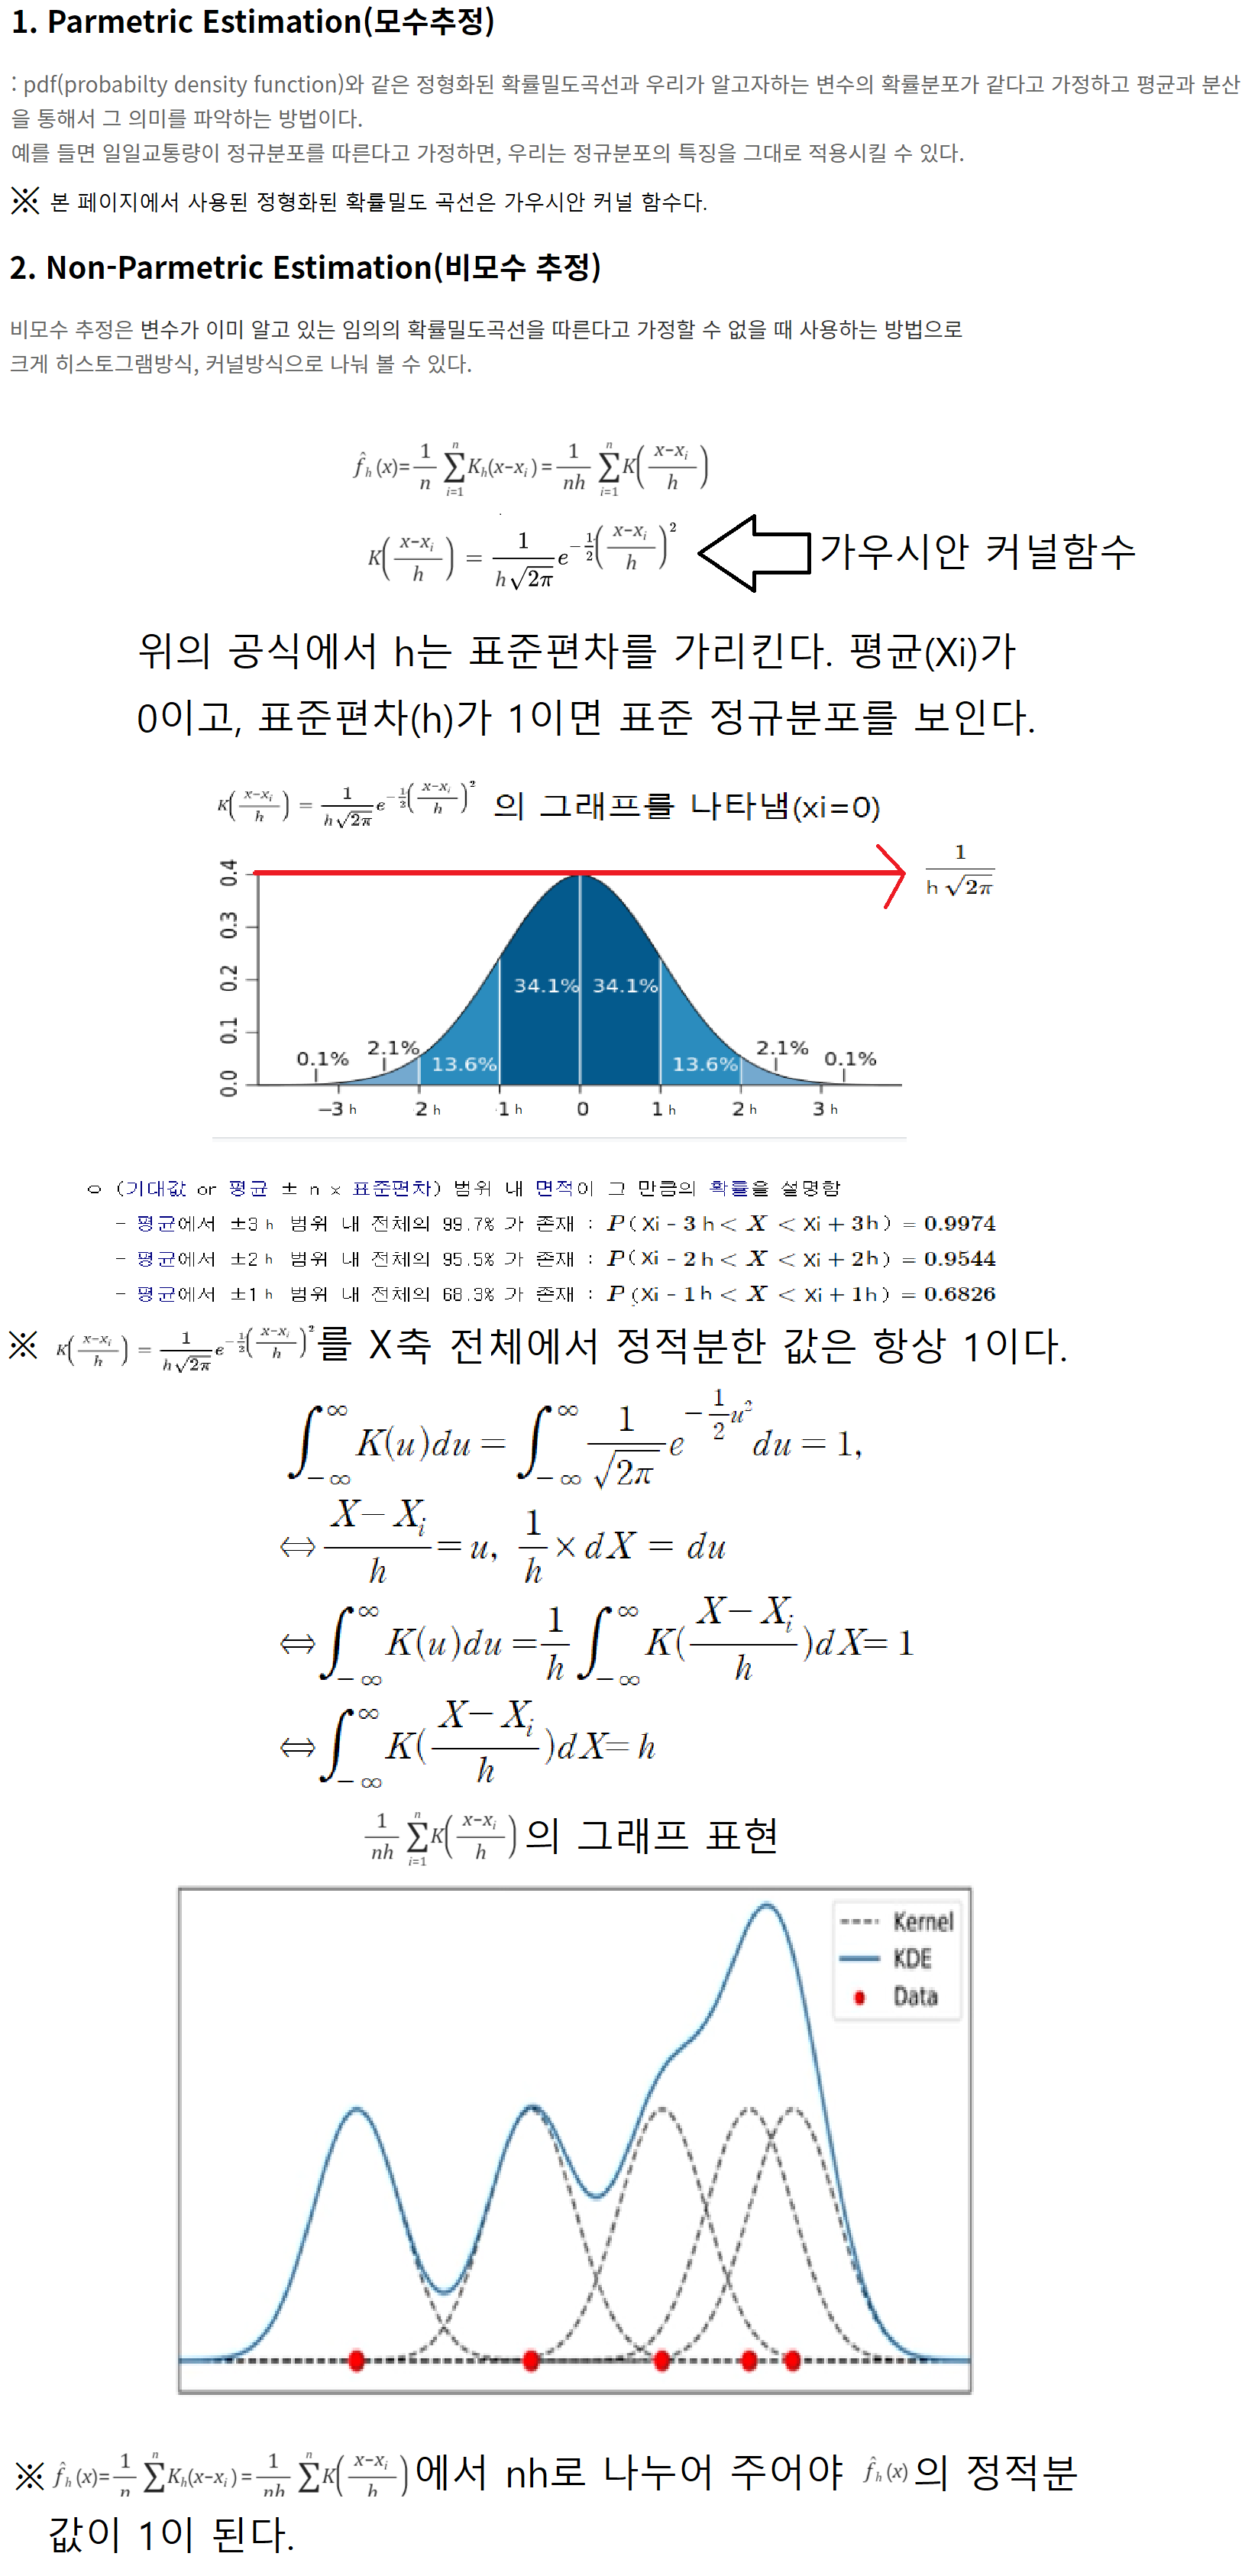
40_Gaussian_Naive_Bayes_가우시안나이브베이즈


import warnings
warnings.filterwarnings('ignore')
import numpy as np
import pandas as pd
import sklearn
가우시안 나이브 베이즈를 활용한 붓꽃 분류
iris 데이터를 활용해 데이터의 특징에 따라 붓꽃의 종류를 구분한다.
# 사이킷런에서 제공하는 iris 데이터를 불러오기 위해서 import 한다.
from sklearn.datasets import load_iris
# 학습 데이터와 테스트 데이터를 손쉽게 나눌 수 있도록 import 한다.
from sklearn.model_selection import train_test_split
# 가우시안 나이브 베이즈로 iris 데이터를 분류하기 위해 import 한다.
from sklearn.naive_bayes import GaussianNB
# 분류 성능을 측정하기 위해 사이킷런의 metrics 모듈의 accuracy_score, classification_report를 import 한다.
from sklearn.metrics import classification_report
from sklearn.metrics import accuracy_score
# iris 데이터 셋을 불러온다.
dataset = load_iris()
# print(type(dataset)) # sklearn.utils.Bunch
# print(dataset.feature_names) # 열 이름
# 'sepal length (cm)' => 꽃 받침 길이, 'sepal width (cm)' => 꽃 받침 너비, 'petal length (cm)' => 꽃잎 길이,
# 'petal width (cm)' => 꽃잎 너비
# print(dataset.data) # 데이터
df = pd.DataFrame(dataset.data, columns=dataset.feature_names)
# print(dataset.target) # 실제값, 0 => 'setosa', 1 => 'versicolor', 2 => 'virginica'
df['target'] = dataset.target
df.target = df.target.map({0: 'setosa', 1: 'versicolor', 2: 'virginica'})
# print(type(df))
df
| sepal length (cm) | sepal width (cm) | petal length (cm) | petal width (cm) | target | |
|---|---|---|---|---|---|
| 0 | 5.1 | 3.5 | 1.4 | 0.2 | setosa |
| 1 | 4.9 | 3.0 | 1.4 | 0.2 | setosa |
| 2 | 4.7 | 3.2 | 1.3 | 0.2 | setosa |
| 3 | 4.6 | 3.1 | 1.5 | 0.2 | setosa |
| 4 | 5.0 | 3.6 | 1.4 | 0.2 | setosa |
| ... | ... | ... | ... | ... | ... |
| 145 | 6.7 | 3.0 | 5.2 | 2.3 | virginica |
| 146 | 6.3 | 2.5 | 5.0 | 1.9 | virginica |
| 147 | 6.5 | 3.0 | 5.2 | 2.0 | virginica |
| 148 | 6.2 | 3.4 | 5.4 | 2.3 | virginica |
| 149 | 5.9 | 3.0 | 5.1 | 1.8 | virginica |
150 rows × 5 columns
데이터 시각화
setosa_df = df[df.target == 'setosa']
versicolor_df = df[df.target == 'versicolor']
virginica_df = df[df.target == 'virginica']
꽃 받침 길이


#https://wikidocs.net/159927
#https://darkpgmr.tistory.com/147
ax = setosa_df['sepal length (cm)'].plot(kind='hist')
setosa_df['sepal length (cm)'].plot(kind='kde', ax=ax, secondary_y=True, title='setosa sepal length (cm) distrubution',
                                    figsize=[8, 4])
<AxesSubplot:label='7c4da28c-cf85-45da-b77a-4f85ad551c0f'>
 꽃 받침 너비
ax = setosa_df['sepal width (cm)'].plot(kind='hist')
setosa_df['sepal width (cm)'].plot(kind='kde', ax=ax, secondary_y=True, title='setosa sepal width (cm) distrubution',
                                    figsize=[8, 4])
<AxesSubplot:label='532e2c24-4336-4397-9be1-f9994c383ba2'>

꽃잎 길이
ax = setosa_df['petal length (cm)'].plot(kind='hist')
setosa_df['petal length (cm)'].plot(kind='kde', ax=ax, secondary_y=True, title='setosa petal length (cm) distrubution',
                                    figsize=[8, 4])
<AxesSubplot:label='e6906f89-fd8e-4653-8523-68bdc1ca5ba7'>

꽃잎 너비
ax = setosa_df['petal width (cm)'].plot(kind='hist')
setosa_df['petal width (cm)'].plot(kind='kde', ax=ax, secondary_y=True, title='setosa petal width (cm) distrubution',
                                    figsize=[8, 4])
<AxesSubplot:label='814eba03-378b-41d4-876c-5f5ba9ad3e8b'>

데이터 다듬기
# 전체 데이터를 80%는 학습에 사용하고 나머지 20%는 테스트에 사용한다.
x_train, x_test, y_train, y_test = train_test_split(dataset.data, dataset.target, train_size=0.8, test_size=0.2)
print('x_train: {}, x_test: {}'.format(len(x_train), len(x_test)))
print('y_train: {}, y_test: {}'.format(len(y_train), len(y_test)))
print('꽃받침 길이, 꽃받침 너비, 꽃잎 길이, 꽃잎 너비(문제): {}, 품종(답): {}'.format(x_train[0], y_train[0]))
x_train: 120, x_test: 30
y_train: 120, y_test: 30
꽃받침 길이, 꽃받침 너비, 꽃잎 길이, 꽃잎 너비(문제): [7.4 2.8 6.1 1.9], 품종(답): 2
가우시안 나이브 베이즈 모델 학습
model = GaussianNB()
model.fit(x_train, y_train)
GaussianNB()
테스트

predict = model.predict(x_test) # 학습 결과에 따른 테스트 데이터의 예측값을 계산한다.
print(classification_report(y_test, predict)) # 테스트 데이터의 실제값, 예측값
# accuracy: 정확도, precision: 정밀도, recall: 재현율, f1-score: f1 점수
              precision    recall  f1-score   support

           0       1.00      1.00      1.00        11
           1       0.91      1.00      0.95        10
           2       1.00      0.89      0.94         9

    accuracy                           0.97        30
   macro avg       0.97      0.96      0.96        30
weighted avg       0.97      0.97      0.97        30
print('정확도(accuracy): {}'.format(accuracy_score(y_test, predict))) # # 테스트 데이터의 실제값, 예측값
정확도(accuracy): 0.9666666666666667
comparsion = pd.DataFrame({'실제값': y_test, '예측값': predict})
comparsion
| 실제값 | 예측값 | |
|---|---|---|
| 0 | 0 | 0 |
| 1 | 1 | 1 |
| 2 | 0 | 0 |
| 3 | 0 | 0 |
| 4 | 2 | 2 |
| 5 | 1 | 1 |
| 6 | 2 | 2 |
| 7 | 2 | 2 |
| 8 | 0 | 0 |
| 9 | 0 | 0 |
| 10 | 0 | 0 |
| 11 | 1 | 1 |
| 12 | 0 | 0 |
| 13 | 1 | 1 |
| 14 | 1 | 1 |
| 15 | 2 | 1 |
| 16 | 1 | 1 |
| 17 | 1 | 1 |
| 18 | 2 | 2 |
| 19 | 2 | 2 |
| 20 | 1 | 1 |
| 21 | 0 | 0 |
| 22 | 0 | 0 |
| 23 | 2 | 2 |
| 24 | 1 | 1 |
| 25 | 2 | 2 |
| 26 | 0 | 0 |
| 27 | 0 | 0 |
| 28 | 2 | 2 |
| 29 | 1 | 1 |
댓글남기기